The same moniker "Manipulative Monday" repeats itself again. At this point, it doesn't rocket scientist to figure out what's gonna happen every Monday. Gold and Silver down and the DOW up. Can the market manipulators please change the date or is that too much to ask? In the grand scheme of things, it really doesn't matter. But it does beg the question.... How easy is it to manipulate markets? (This is for your nay sayers out there.) This process is fairly easy and
straight forward. For the Dow, S&P500, NASDAQ - they just have to pound the index and mess around with futures contracts. For Gold and Silver - concentrated "naked or not" short or long positions. The two biggest markets - Bond and Foreign Exchange (FOREX) are relatively free of manipulation because the markets are too big for any shenanigans and would take enormous amounts of money to make a difference.
Around 90% of stock market trades use "black box" technology that use complex algorithms such as Fibonacci levels, oversold/overbought indicators, moving average calculators and the list goes on. That's why I include the charts. Look at the dam charts. I know they look like a bunch of squiggly lines that look non-random, but the charts are extremely telling. I'm generally 80% or better in predicting market direction and price movement. The other 20% is luck because "Black Swans" have a tendency to pop up - aka the unexpected. Now let's look at the charts.
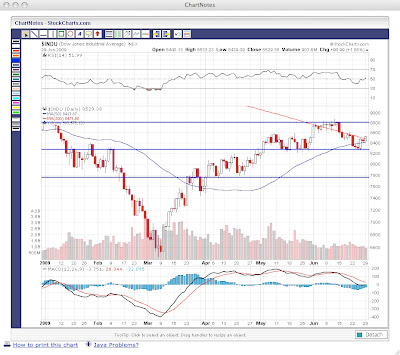
The first up is the DOW. As you can see, the DOW is trading sideways. It's in a trapped trading range between 8250 low and 8800 high. The RSI (Relative Strength Indicator) is a momentum oscillator. It displays if a stock is overbought or oversold. It ranges from zero (oversold) to 100 (overbought). Currently, the RSI for the DOW is sitting at 52 which is neutral. The next indicator we should look at is the MACD (Moving Average Convergence
Divergence) indicator on the bottom of the chart. The MACD is generally a "lagging" indicator used to confirm market direction and overbought and oversold levels. (If you want more info
on the MACD, google it.) The MACD is also neutral at the moment, but is displaying a slight bias towards upward movement which is the result of a nice 90 point rally yesterday and last Thursday. The next indicator is the 50 and 200 day moving average as seen on the main chart with blue and red lines. Whenever the 50 day moving average crosses over the 200 day moving average, it can signal which direction the market is moving. If the 50 crosses upwards though the 200, this can signal an upward trend. Conversely, if the 50 crosses downward through the 200 it can signal downward price movement. The 50 and 200 can also be used as support level indicators, but we'll skip that for now. The 50 and 200 on the DOW chart haven't crossed over in at least 9 months, so this is starting to get interesting. With the impending cross-over, will this actually push the DOW through 8800 and into a new trading range? Combine that with a neutral MACD and RSI and it's looking very positive at the moment. Also, you must factor in the strength of the US Dollar. The stock market generally moves inversely to the USD. If the dollar index is up, the DOW is generally down and the exact opposite applies. So you must ask yourself this...Is the stock market strong or is the dollar weak? My opinion is this upward price move is a result of a weak dollar. The mass media will tell you that a recovery is on the way because the market is strong. Hogwash! Weak Market that is getting the benefit of the extremely weak dollar. Let's watch and see if it can break 8800 on this weak dollar move.
Below is the Dollar Index Chart. The dollar is trading in a range
between 81 high and 78 low. Watch for the dollar breaking below
78. The next stop will be 71. If it breaks 71, look out below!

Next up - Gold. How bullish does this chart look? With
a weak dollar, look for a run at 1,000 in the near future.
Remember, the dollar is the key! If the dollar strengthens,
look for a brief correction downwards. Look at mid and
long term price projections and movements. Like I said
numerous times if you Gold drops below 900 buy by the
trick load!

Last but not least Silver! Silver is going to 16.00 and beyond!


No comments:
Post a Comment