Disclaimer

Investing involves some degree of risk. Investors should inform themselves of the risks involved before engaging in any investment. I accept no responsiblity for your failures as an investor. Disclosure - Long physical Gold, Silver, and mining companies.

Tuesday, June 30, 2009

A quick look at the charts


The same moniker "Manipulative Monday" repeats itself again. At this point, it doesn't rocket scientist to figure out what's gonna happen every Monday. Gold and Silver down and the DOW up. Can the market manipulators please change the date or is that too much to ask? In the grand scheme of things, it really doesn't matter. But it does beg the question.... How easy is it to manipulate markets? (This is for your nay sayers out there.) This process is fairly easy and
straight forward. For the Dow, S&P500, NASDAQ - they just have to pound the index and mess around with futures contracts. For Gold and Silver - concentrated "naked or not" short or long positions. The two biggest markets - Bond and Foreign Exchange (FOREX) are relatively free of manipulation because the markets are too big for any shenanigans and would take enormous amounts of money to make a difference.

Around 90% of stock market trades use "black box" technology that use complex algorithms such as Fibonacci levels, oversold/overbought indicators, moving average calculators and the list goes on. That's why I include the charts. Look at the dam charts. I know they look like a bunch of squiggly lines that look non-random, but the charts are extremely telling. I'm generally 80% or better in predicting market direction and price movement. The other 20% is luck because "Black Swans" have a tendency to pop up - aka the unexpected. Now let's look at the charts.

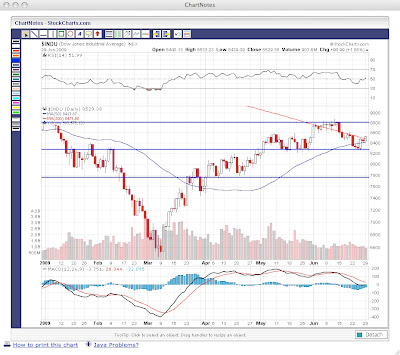
The first up is the DOW. As you can see, the DOW is trading sideways. It's in a trapped trading range between 8250 low and 8800 high. The RSI (Relative Strength Indicator) is a momentum oscillator. It displays if a stock is overbought or oversold. It ranges from zero (oversold) to 100 (overbought). Currently, the RSI for the DOW is sitting at 52 which is neutral. The next indicator we should look at is the MACD (Moving Average Convergence
Divergence) indicator on the bottom of the chart. The MACD is generally a "lagging" indicator used to confirm market direction and overbought and oversold levels. (If you want more info
on the MACD, google it.) The MACD is also neutral at the moment, but is displaying a slight bias towards upward movement which is the result of a nice 90 point rally yesterday and last Thursday. The next indicator is the 50 and 200 day moving average as seen on the main chart with blue and red lines. Whenever the 50 day moving average crosses over the 200 day moving average, it can signal which direction the market is moving. If the 50 crosses upwards though the 200, this can signal an upward trend. Conversely, if the 50 crosses downward through the 200 it can signal downward price movement. The 50 and 200 can also be used as support level indicators, but we'll skip that for now. The 50 and 200 on the DOW chart haven't crossed over in at least 9 months, so this is starting to get interesting. With the impending cross-over, will this actually push the DOW through 8800 and into a new trading range? Combine that with a neutral MACD and RSI and it's looking very positive at the moment. Also, you must factor in the strength of the US Dollar. The stock market generally moves inversely to the USD. If the dollar index is up, the DOW is generally down and the exact opposite applies. So you must ask yourself this...Is the stock market strong or is the dollar weak? My opinion is this upward price move is a result of a weak dollar. The mass media will tell you that a recovery is on the way because the market is strong. Hogwash! Weak Market that is getting the benefit of the extremely weak dollar. Let's watch and see if it can break 8800 on this weak dollar move.


Below is the Dollar Index Chart. The dollar is trading in a range
between 81 high and 78 low. Watch for the dollar breaking below
78. The next stop will be 71. If it breaks 71, look out below!


Next up - Gold. How bullish does this chart look? With
a weak dollar, look for a run at 1,000 in the near future.
Remember, the dollar is the key! If the dollar strengthens,
look for a brief correction downwards. Look at mid and
long term price projections and movements. Like I said
numerous times if you Gold drops below 900 buy by the
trick load!


Last but not least Silver! Silver is going to 16.00 and beyond!


Monday, June 29, 2009

Q&A

I get a lot of questions on certain market issues, so I will try and answer a few of them.

Q: Are we in a Recession or Depression?

A: Depression - we entered into a depression in FEB

Q: What type of depression will this be - Inflationary or Deflationary?

A: We should see a brief period of hyper-inflation followed by real deflation not asset deflation what your witnessing now.

Q: What is the current unemployment rate?

A: Officially around 9 % and unofficially(Pre-Clinton Formula) around 20%.

Q: Where is the DOW headed?

A: My best estimate would around the 3,800 to 5,200.

Q: What should I invest in to protect myself from the tidal wave of inflation?

A: Gold, Silver, Mining Companies, and related shares.

Q: Are there any green shoots of economic recovery?

A: No

Q: Will there be a Stimulus II package?

A: Yes

Q: Will things get much worse?

A: Yes

Q: Are we going to have a currency crisis with the U.S. Dollar?

A: Yes

Q: I don't have a lot money. What can I invest in?

A: Go to your local coin store and buy "junk silver coins" or Eagles, Maples, and Philharmonic coins. Don't buy a lot at one time. Slowly accumalate. You shouldn't be paying over 20.00 for
one ounce of silver.

Q: What is the projected price of gold in the next 12 months?

A: 1,200 to 1,500 an ounce and within the next three the price will be over 2,000 conservatively.

Q: What about silver?

A: 25 is the intial target and within the next three years a conservative target would be 40 to 60.

Q: Will gas and oil prices rise?

A: Yes, they're traded and priced in dollars. The dollar index is at 79ish. The dollar should
retest the 71 low and easily break through and head towards 50.

Q: Where are we at in this whole process?

A: We are currently in the "eye" of the storm.

Q: If we're in the "eye" of the storm, when will the storm resume?

A: September to November

Q: Are you always this negative or pessimistic?

A: Trick question. Look at the numbers for yourself. It seems everyone is
sitting on their hands waiting for the proverbial next shoe to drop. My question
is why is everyone sitting and waiting. Be proactive. I think one reason why people
are sitting around waiting is because the mass news media is giving terrible advice and
trying to be overly optimistic. The average American knows this is a catostrophe waiting
to happen, but they're in a state of denial or shock and refuse to do anything about it.

Q: What is the next crisis?

A: Derivatives, Mortgages (ARMs/ALT A), Commericial Real Estate, and a Dollar devaluation.


Saturday, June 27, 2009

The International Forecaster (June 27, 2009) by Bob Chapman

As you have already seen this is a worldwide depression and no one will escape. Europe’s economy is already in a shambles as is the US economy. Inflation will rage all over the world, because every nation has created massive amounts of money and credit as demanded by US and British elitists. They have all overmedicated the patient. As the Broadway hit play of many years ago told us, we are going to have to go through a “Period of Adjustment.” Some nations will get off easier than others. There will be no decoupling and many nations could have revolutions.

Government spending and increased debt has been taken on by all countries and to in part pay for that taxes will rise everywhere. Deficits will hit records as far as the eye can see. You can’t have massive spending, massive debt and massive tax increases and expect to have growth. It is impossible.

Thus far government has been able to paper over the systemic meltdown in the financial area. They still haven’t dealt with off balance sheet and derivative losses. Even with the trillions poured into these entities it has not been enough to solve their problems and over the next few years that will become obvious.

The Treasury plans of having the fox, the Fed, take over the chicken coop is pure insanity. These are the very people who caused the problem by encouraging mis-rating, securitization and lending that defied reality. Now the Fed is to become policeman. It is really insulting and removes any sense of security from the system.

The problem of protecting consumers lies in the hands of the Fed, raters, lenders and Wall Street. Greed overcame any semblance of prudence.

The Treasury, as stated under the Constitution, should have the authority to solve financial crisis, but they cannot because the Fed has the tools to do so. Those tools have to be put in the hands of the Treasury again. It is not a cure all, but it is a step forward. That has to be accompanied by ending the revolving door between banking, Wall Street and the positions appointed in Washington, especially the Treasury.

Giving the Fed more powers to regulate is not addressing the underlying problem and shifting private debt into public debt isn’t an answer either. The main cause of the problem is leverage, securitization, and globalization and the massive use of derivatives. Free trade and globalization are the worst and have caused wage-price imbalance and stripping America of its ability to compete.

The advantages all accrue to transnational conglomerates and third world nations. This enriches the rich and takes the living standards in the US, Canada and Europe down to the levels of the third world.

Why would our president want the Fed to have day-to-day supervision over the largest bank holding companies, which own the Fed? This is the group that caused all these failures. The Fed would have a financial empire that would allow them to engage in greater corruption. It would control a financial colossus.

Then the FDIC would receive more powers to wind down whatever banks they decided would be eliminated. If large banks can be bailed out, why can’t small banks receive equal treatment? That is because the big banks want to absorb the small and medium-sized banks eventually leaving us with 20 with a monopoly in banking. This is where this is headed. We are also told many more banks have gone under than we’ve been told about. Insiders expect 500 to 800 will go under this year, not the publicly announced 35 or 45.

Thus, the Fed and the FDIC are to be rewarded for failure. They didn’t use their regulatory powers over banks in mortgage lending, rating and securitization.

The plan of the administration is a copy of the Paulson plan to concentrate more power with the Fed. They have eliminated the Office of Thrift Supervision and merged it with the Comptroller of the Currency.

They previously proposed a merger of the CFTC and SEC, which isn’t about to happen.

The litany goes on and American waits for the other shoe to drop as it falls deeper into depression. As you can see this is a struggle to give the Fed total financial control over America. It can only end in disaster.

The Fed may revamp the repo market for they fear existing arrangements could put the clearing banks in a difficult position in a crisis. As securities’ values fall, clearing banks have to demand more capital or collateral to avoid losses. In that process they could destabilize the market. Positions of investment banks are so large that a default could be fatal. The solution, of course, is that the Fed takes over the defaulted positions to keep its monopoly in tact. The two banks at great risk are JPMorgan Chase and Bank of NY Mellon, both shareholders in the Fed.

A quarter of US employers have eliminated matching contributions to employee 401(k) retirement plans since September. Most say it is temporary, but we don’t believe it.

If exports don’t pick up soon the IMF says the dollar will need to be devalued.

JPMorgan Chase & Co. is raising some balance-transfer fees on credit cards to 5 percent, the highest among the nation’s largest banks, citing increasing regulations and costs after the United States put new curbs on the industry.

The lender starts charging more in August, just as the law to curb interest-rate increases, fees, and marketing practices begins to take effect.

The credit card law President Obama signed May 22 prompted warnings from industry executives that they’d be forced to raise fees, curtail credit, and restrict consumer rewards programs. Congress heard testimony yesterday on Obama’s proposed Consumer Financial Protection Agency, which would have authority over increases like the boost JPMorgan is planning, said the chairman of the House Financial Services Committee, Barney Frank.

“What Chase is doing is strengthening the argument for the new entity,’’ Frank, a Massachusetts Democrat, said yesterday before the hearing. Banks should be able to impose fees to cover their costs, not to create a “new profit center,’’ he said.

JPMorgan’s previous average fee for balance transfers was 3 percent, spokesman Paul Hartwick said. He declined to say how many customers will be affected. The increase also applies to cash advances, and fixed interest rates will become variable, the notice said. JPMorgan may choose to offer a lower transfer fee, the notice said; Hartwick declined to elaborate.

“In the current economic environment, our costs of doing business have been impacted by increased losses,’’ Hartwick said in an e-mail. “We are increasing balance-transfer fees to reflect the increasing costs.’

A 65-year-old Massachusetts investment manager pleaded guilty yesterday to securities fraud for running a Ponzi scheme that cost 70 investors, many from the Bay State, about $9 million.

Michael C. Regan, 65, faces up to 20 years in jail and $5 million in penalties after settling the criminal charges with federal officials in New York. He also settled similar civil charges with the Securities and Exchange Commission, in which he agreed to repay more than $8.7 million.

Officials have not yet determined whether Regan has money or other assets to repay his victims.

And he could face additional fines, SEC spokesman David Rosenfeld said. “We’ll try to find whatever can be recovered in order to [get it] to the investors,’’ he said.

Formerly of Wayland, Regan now lives in Quincy. He was released on bail, with a date for sentencing yet to be set, said a spokesman for the US attorney’s office in Brooklyn.

Like convicted swindler Bernard L. Madoff, Regan promised investors consistently high returns. He told them his River Stream Fund had earned about 20 percent a year since 2001, using a trading strategy based on short-term market trends, authorities said. In fact, River Stream lost money or had minimal returns most of the time, paid as much as $9 million in bogus profits, and returned capital to investors with money given to him by other investors, according to court documents. Meanwhile, Regan took more than $2.5 million in fees for himself.

Before his fund collapsed in April 2008, Regan claimed it held about $18 million, when in reality it had only $101,600, according to prosecutors.

Regan’s lawyer, Raymond Mansolillo, did not return calls seeking comment.

The Labor Department said the number of mass layoff actions -- defined as job cuts involving at least 50 people from a single employer -- increased to 2,933 in May from 2,712 in April, resulting in the loss of 312,880 jobs. [This is further evidence of the absurdity of BLS’s 225k job creation in its B/D Model.]

Household-products maker Kimberly-Clark Corp. said Thursday it plans to cut 1,600 jobs, or 3 percent of its global work force, as it slims down in the tough economy.

The maker of Kleenex tissues, Huggies diapers and scores of other household items employs 53,000 people around the world. It plans to make the cuts primarily among salaried and non-production workers and executives said the company doesn't plan to close any plants.

The number of Americans filing claims for unemployment benefits unexpectedly rose last week, a reminder that companies will keep cutting staff even as the economy stabilizes.

Initial jobless claims rose by 15,000 to 627,000 in the week ended June 20, from a revised 612,000 the week before, the Labor Department said today in Washington. A report from the Commerce Department showed gross domestic product shrank at a 5.5 percent annual pace in the first three months of the year.


Friday, June 26, 2009

Got GAS?

With oil hovering around 70 dollars a barrel, where is unleaded gasoline headed? The first question one must ask is.....Where's all this deflation everyone talking about? Besides personal asset deflation (home valuations, savings interest rates) you'll be hard pressed to find deflation anywhere. Gasoline and Oil are traded in dollars. If the dollar declines in value, the higher Gas and Oil prices will be. Pretty Simple. What's in the cost of a gallon of gas?Base Price + Fed Tax of 18.4 cents per gallon + State Tax average of 20 cents per gallon + State Sales Tax around 5% average + Gas Station Charges = WHAT YOU PAY AT THE PUMP. Now look at the charts and see if you can figure out where unleaded gas is headed.


Thursday, June 25, 2009

What's Silver up to?

Why would someone buy physical silver and take delivery?
Ummm. No counter-party risk. If you buy physical silver or gold,
the only ponzi or pyramid scheme your susceptible to is how you
stack it in your safe. I stack mine like a pyramid. I use the bars to
build the pyramid and take my rolls of Silver coins to build the
pillars guarding my pyramid. Hidden deep inside my pyramid I
have gold coins. Have you ever watched the movie National Treasure?
Get my point! Buy Gold and Silver people or be prepared to get
annihilated. After they're done luting the stock market, they will
take the winnings and push Gold and Silver to unheard of prices.
If you don't believe me, keep buying worthless paper and subject
yourself to counter-party risk. Another cause for great concern is
a dollar devaluation event which is on the horizon. How do you
protect yourself against devaluation of the dollar or an outright collapse?

On to the charts. Silver is sitting in no man's land at the moment.
The weekly chart is sitting in a reverse head and shoulder formation.
Lowside resistance is at 13.20 and upper resistance is formed at 16.90.
The daily chart is also in a reverse head and shoulder formation with
downside resistance at 12.10 and upside resistance at 16.60. If Silver
attempts to retest these downside resistance points, I am a buyer!

Daily and Weekly Chart:


Wednesday, June 24, 2009

The Future Projection of the DOW

They started the bubble and I just finished it for them. The correct bottom for the
DOW is between 3,800 and 5,200 - if we're lucky. More aggressive analysis suggests
1,800 is also possible. Once the DOW starts beating a path downward towards 5,200, Gold
will start a tremendous upward run and they will meet in the 3,000 area for a 1 to 1 ratio.
If you think this is out of the question, keep searching for those "green shoots". Let me know
when and where you found them because a little "Roundup" will kill those weeds.

Here we go again...The Great Inflation vs Deflation debate

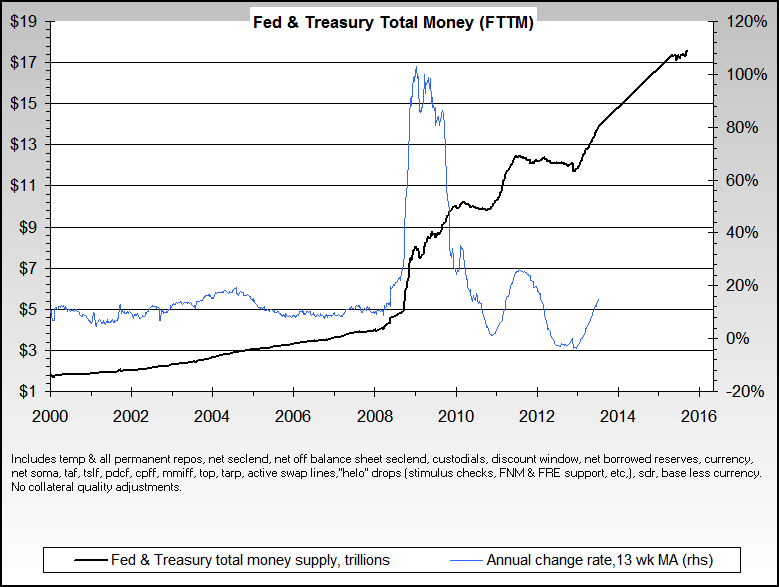
Once again, we have the inflation vs deflation debate popping up. For the record, I'm firmly in the inflation camp. Like I said in a previous post, inflation is a monetary phenomenon caused by excessive printing of money to pay government debt. If the printing of money exceeds the annual inflation rate, it will lead to unexpected consumer price inflation down the road (about 24 months). The current official CPI number is negative 1.2%. Now let's take a look at the M1 money supply. From June 2006 to June 2008, the M1 bounced between 0% and negative 1.5% Hmmm -24 months. Now you're probably wondering what the current M1 number is. Well, from June 08 to present, it went from zero to 16.3% and is currently bouncing between 14% and 16%. You will see this monetary inflation show up in consumer price inflation by June 2010. This freshly printed money is currently being held up by the Fed and the big banks. It's currently being used to buy Treasuries and to mop up toxic garbage bets. A little monetizing of debt never hurt anyone? Google this: What caused hyper-inflation in Zimbabwe or Weimar Republic.

Tuesday, June 23, 2009

Ramblings on the Stock Market, Gold, and the US Dollar


Let's try a little different approach to try and figure out where the Stock Market is headed. Most so called experts use the S&P500 Chart instead of the DOW, but since the charts look almost identical we'll stick with the Dow for now. Since the DOW and the US Dollar index are inversely correlated, I took the DOW chart and divided it by the USD index. Have you ever noticed when the Dollar is strong the market is down and the exact applies? The same thing could be said for Gold, Silver, and Oil versus the USD. Now with that said...Wouldn't it be nice if we had a stable currency, but I guess that would be asking too much. A currency backed by Gold or Silver would provide a stable currency and inflation/deflation would be very easy to predict. You wouldn't have these boom and bust bubble-a-thons that always teeter on mass inflation and a deflationary spiral. Just for the record. I asked 10 people what the dollar was backed by and 9 out of 10 said Gold. Really people! The Gold window was closed in 1971. The US dollar is a debt instrument and is backed by notes and bonds. Since 1913, the dollars has lost 96% of it's purchasing power. I will lay this out plain and simple for all you Gold doubters
out there. The price of Gold was $20.00 an ounce. You could buy a complete suit, tie, and shoes for 20 dollars or one ounce of Gold. What does 20 dollars get you today? A cheap tie from a discount store. What does one ounce of Gold buy you today? A complete suit, tie, and shoes. I could apply this same logic to a house or car. It doesn't matter. The price of Gold hasn't changed in over 100 years! What has changed is the value of the dollar! Like I said it has lost over 96% of it's purchasing power. O.K.....enough of that. Let's get back to the charts.

By taking a glance at the DOW versus the dollar chart, we can see a clear head and shoulder formation on the chart. What does this tell us......It appears the stock market will have a correction downward and the dollar will strengthen. SPECIAL NOTE - The Fed is meeting to decide if they should devalue the dollar. This could trigger a decoupling event between the Stock Market and the Dollar. Yes, this would include Gold, Silver, and Oil.

Monday, June 22, 2009

Nightmarish Financial Numbers by The Mogambo Guru

Nightmarish Financial Numbers

leadimage

06/22/09 Tampa Bay, Florida Minyanville.com had the headline, “Velocity of Money Comes to a Standstill.” The report starts off with the news that “Current consumption, which at $8.2 trillion is around 70% of GDP, has fallen $150 billion from last year,” and that investment, which represents things like building factories, is $1.3 trillion or 11% of GDP, and down 23.3% from last year.”

This is certainly bad news, although I am always leery of the concept of velocity, as it is just the plug number that makes Fisher’s famous equation (MV = PQ) work out, namely that the Money supply times the turnover of the money (Velocity) equals the Quantity of things sold times the Price of those things that were sold. Simple.

So since the Money supply (as measured by M2) is growing at almost 9%, Prices overall (as measured by the broad CPI) are not growing very much, and the Quantity of goods sold is way down as consumers stop consuming since they are out of money and credit, thenVelocity must, by arithmetical necessity, be going down. Now do you know something that you didn’t already know?

But perhaps this seeming fascination with velocity has something to do with why Bloomberg.com reports that “U.S. household wealth fell in the first quarter by $1.3 trillion, extending the biggest slump on record, as home and stock prices dropped.”Yikes! And in just the first three months of the year!

You may be thinking to yourself, “Well, since the Worthless Mogambo Idiot (WMI) goes ballistic at the drop of a hat these days, probably as a result of his having such a tenuous and apparently transitory grasp of reality, maybe he is just over-reacting, and this is not so much.”

If you are one of those people who thinks such things, then I laugh – Hahaha! – in your face, and in response to the quizzical look on your face at my sudden rude arrogance, I hold up the rest of the article where it says, “Net worth for households and non-profit groups” is a nice, tidy $50.4 trillion, which seems like a lot of money, but which is actually the “lowest level since 2004,” and which was down from $51.7 trillion in the fourth quarter.

For some reason, they add, “The government began keeping quarterly records in 1952,” probably as a reassuring way of saying, “If you ignore the staggering loss of buying power of the dollar, which one experiences as a rise in prices, and you ignore the costs of all the taxes, fees and expenses of the cost of holding and accumulating all this net worth, and you only look at nominal prices then and now, then it looks like you are a lot better off than you were in 1952, and we have records to prove it, no matter what that Stupid Mogambo Loudmouth (SML) has to say about it!”

For homeowners, the bad news is that the report showed that “Owners’ equity as a share of their total real-estate holdings decreased to 41.4 percent last quarter from 42.9 percent in the fourth quarter,” which is bad news from the perspective of The Bad Old Days (TBOD) when Mortgage Equity Withdrawal (where homeowners were stupidly borrowing the increased “equity” that resulted from their houses going up in value so that they could spend it on sex, drug and rock & roll), was running in the hundreds of billions of dollars a year, fantastically super-charging the economy.

The ugly bottom line is that “The economy contracted at a 5.7 percent annual pace in the first quarter and consumer spending rose at a 1.5 percent pace.”

Thus, the habit is engrained, as “Total borrowing by consumers, businesses and government agencies increased at an annual rate of 4.1 percent last quarter compared with a 6.2 percent gain the prior quarter. The gain was paced by a 23 percent surge in borrowing by the federal government, reflecting spending linked to the stimulus plan.”

And this doesn’t even count, of course, “Borrowing by state and local governments increased at a 4.9 percent rate”, as they continue their habit of spending more than they can take in.

Bill Bonner here at The Daily Reckoning notes that, as we see, “some habits are hard to break. The habit of getting something for nothing is one of them,” and at this rate, “The official US debt is exploding. Bill Gross says it will be 100% of US GDP within 5 years.”

Instantly my mind goes into some kind of weird dream and all I can see is three numbers floating around, bumping into one another. One of them is $14 trillion (which is GDP), and the other two are the number $11.3 trillion (which is the current national debt), and the last one is the number $3 trillion (which is how much MORE national debt will accrue this year alone) because of the sheer staggering amount of irresponsible deficit-spending the federal government will almost certainly commit this year, including the already-announced eye-popping $1.84 trillion in budget deficits and Another Freaking Trillion (AFT) or so in “surprise!” emergency supplemental appropriations as the year goes along, as is Congress’s habit, altogether an insane amount of new money that guarantees ruinous inflation in consumer prices, which is the outward manifestation of the purchasing power of the dollar going down due to unprecedented creations of more and more money diluting the money stock, a devastating process which leads to social upheavals, a prospect which scares me so much that statistical analysis shows I usually pee in my pants in fear.

That is why I usually wear an adult-sized diaper when reading economics news, a habit I suggest that you get into, too, if you are going to keep up with the economics stuff, because you are going to get some nasty shocks, such as Mr. Bonner saying that national debt exceeding GDP in 5 years is actually optimistic, and that his “guess is that it will reach that level even sooner” which is one of those dense oracular announcements that could mean anything, such as “We’re all freaking doomed because the damned GDP may go down by a lousy 20%, making existing federal debt equal 100% of the economy Right Freaking There (RFT)!”

Or he could mean that “We’re all freaking doomed because the damned economy will remain at a standstill, at best, while the debt grows like a cancer, resulting in a debt-to-GDP exceeding 100%.”

Either way, the news is bad, except for those who have been buying gold, silver and oil, and for them the news will be good! Whee! This investing stuff is easy!

Until next time

The Mogambo Guru
for The Daily Reckoning

Author Image for The Mogambo Guru

The Mogambo Guru

Richard Daughty (Mogambo Guru) is general partner and COO for Smith Consultant Group, serving the financial and medical communities, and the writer/publisher of the Mogambo Guru economic newsletter, an avocational exercise to better heap disrespect on those who desperately deserve it. The Mogambo Guru is quoted frequently in Barron’s, The Daily Reckoning , and other fine publications.

Special Report:
The Most Aggressive Wealth Creation in History: 47 New Millionaires Every Day… and a New Billionaire Every Month


What causes hyper-inflation?

Think Zimbabwe or Weimar Germany! If you're looking for inflation, you might see a little i.e.
groceries, gas prices, home consumables etc. Keep looking.....Look a little harder. You are
probably not seeing a whole lot. The problem is your not looking in the right place. You
should be looking for monetary inflation. Monetary inflation occurs two years before consumer inflation.
Monetary inflation is the excessive printing of money to pay debt.
The Fed is currently printing excess dollars to buy Government bonds and toxic assets which is
highly inflationary. This massive amount of monetization will lead to consumer inflation rates
exceeding 24% within 12 to 18 months. Remember monetization of debt leads to monetary
inflation and the end result will be consumer hyper-inflation.

Look at the chart and cringe.......you'll probably have nightmares.

fs1

US to Trade Gold Reserves for Cash Through Cash 4 Gold [video - satire]


-- Posted Monday, 22 June 2009 | Digg This ArticleDigg It! | Share this article | Source: GoldSeek.com


The Magic Dow or SP500 trading formula


I developed and studied this concept for a while now. Is this the end all be all trading formula?
Probably not, but it will give you an idea of where the market will cycle through during the
next 90 days. I have tried to make this trading formula as simple as possible, so let give it a try.


1.) Pull up a stockcharts.com chart.

2.) Enter $INDU for the DOW or $SPX for the SP500.

3.) Set to weekly and use 3 years.

4.) Set the type to Line (thin) and size to landscape.

5.) Hit update.

6.) Hit annotate and your chart will pop up.

7.) Hit the vertical line tool.

8.) Draw a line every three boxes. (see my chart)

9.) Now grab the Fibonacci Retracement tool.

10.) Take two consecutive cycles and find the high and low. Place the 100%
marker on the high and 0% on the low. Now stretch the tool one cycle to
the right. Presto! You have your chart laid out for the next cycle along with
price targets.

Special note - This formula only has one rule! If the 100% or 0% marker is
broke, use this formula to figure out the new high or new low.

A.) If the 0% marker is broke, subtract the 38.2% value from the 0%.
Example from the chart. 38.2% (7653.24) minus 0% (6597.85) equals 1,055.39.
Take the 0% (6597.85) and subtract it by 1,055.39. This equals 5,542.46 which
would be your new projected low.

B.) If the 100% marker is broke, subtract the 100% value from the 61.8% value.
Take this value and add it to the 100% value. This would be your new projected high.


Sunday, June 21, 2009

Silver Update by Clive Maund


By: Clive Maund


-- Posted 21 June, 2009 | Share this article | Discuss This Article - Comments: 0 Source: SilverSeek.com

We are believed to be at a good entry point for silver here as the overall pattern is strongly bullish, and the predicted reaction of the past few weeks, which has served to unwind the earlier overbought condition, is now thought to have run its course.

On the 1-year chart we can see that after breaking out of the strongly bullish fine Cup & Handle pattern, silver made a fairly rapid run at the important resistance level in the $16.00 - $16.80 zone, arriving there in a critically overbought condition, as shown by the RSI indicator at the top of the chart, so it is hardly surprising that it has reacted back over the past several weeks. We anticipated this reaction and sidestepped it , which is just as well as we can now buy back both silver and big silver stocks, some of which are about 25% cheaper after the reaction. In the last update the reaction was expected to terminate in the vicinity of the 50-day moving average, which silver is close to now, or at a trendline drawn from the October lows, which is not shown on this chart as it creates too much clutter, but was shown on a 2-year chart in the last update. This trendline is now at about $13.50. However, on Friday the big silvers rose on huge volume - record volume in the case of some of them - and this is believed to be evidence of Smart Money piling in ahead of a new uptrend. For this reason the downtrend in silver is thought to have ended and it is rated an immediate buy, even and especially if it dips early next week. Note that the uptrend channel drawn from the early May low is still provisional and may require adjustment depending on whether we have already arrived at the final low.

The long-term arithmetic chart for silver going back to the start of the bullmarket is interesting as it shows that two very long-term trendlines gave targets for the blowoff top early last year and also the crash low point that followed late in the year. Observe also how silver bottomed late last year just above a zone of important support dating back to the extensive trading in the long 2004 - 2005 trading range. Finally the red downtrend line shown was a tool used in the last update to call the recent top. This downtrend line should be overcome by the next upleg.


Is the Silver bull ready for another run???

To read my analysis/notes click on the Silver chart below.
Also, I included my point and figure chart to see Silver's price
target of 26.00


Comex Gold Default by Trace Mayer, J.D.

By: Trace Mayer, J.D.

FUTURES AND FORWARD CONTRACTS

Many commodities trade via forward or futures contracts. A forward contract is is an agreement between two parties to buy or sell an asset at a specified point of time in the future. A futures contract is a standardized contract to buy or sell a specified commodity of standardized quality at a certain date in the future, at a market determined price (the futures price).

REGULATION AND COUNTER-PARTY RISK

Both futures and forward contracts introduce counter-party risk which depends on the financial ability of the counter-party to perform and may result in a failure to deliver. The calculated counter-party risk of futures contracts are assumed to be lower than forward contracts because they are traded on commodity exchanges. This is because generally governments must provide a common insurance or regulatory standard, such as the Commodity Futures Trading Commission (CFTC), and some release of liability, or at least a backing of the insurers, before a commodity market can begin trading.

COMMODITY MARKET SIZE

As a result of this increased confidence the size of futures contracts has grown tremendously. The major commodities exchanges in the United States were the COMEX and NYMEX which merged under the New York Mercantile Exchange and Commodity Exchange, Inc. (NYMEX) name on 3 August 1994.

The notional value outstanding of OTC commodity derivatives contracts increased 27% in 2007 to $9.0 trillion. OTC trading accounts for the majority of trading in gold and silver. Overall, precious metals accounted for 8% of OTC commodities derivatives trading in 2007, down from their 55% share a decade earlier as trading in energy derivatives rose.

BACKWARDATION

Because of the large aboveground stockpiles of the monetary metals threfore gold and silver should never enter backwardation. Backwardation would be evidence of the market’s increased apprehension of counter-party risk and the increased probability of a failure to deliver. The brief gold backwardation or the recentblack swan of nine weeks of silver backwardation in the London Bullion Market Association (LBMA) forward markets revealed the extreme fragility of the worldwide financial and monetary system.

Mr. Avery Goodman, a securities attorney and a member of the roster of neutral arbitrators of the National Futures Association (NFA) and the Financial Industry Regulatory Authority (FINRA), has also written extensively about whether the COMEX will default on gold and silver, how the NYSE ran out of gold bars, the evidence that the ECB bailed out Deutsche Bank preventing a failure to deliver of gold on the COMEXand a follow up article on the ECB’s saving of the COMEX from a gold default.

Then there are other commentators like Jason Hommel, the creator of the satirical silver CFTC appreciation medallion above, who alleges regulatory culpability. Still others like the Gold Anti-Trust Action Committee (GATA) who has met with CFTC officials bring considerable intellectual firepower to the allegation of a central bank gold price suppression scheme where Mr. Robert Landis, a Harvard trained attorney, asserts “Any rational person who continues to dispute the existence of the rig after exposure to the evidence is either in denial or is complicit.”

TOOLS OF SPECULATION

Due to the size of the derivative contracts traded on the commodity exchanges and the counter-party risk the contracts are impregnated with therefore a bankruptcy of either the counter-party, the exchange or both could happen. Due to the increased liquidity of these exchanges many of those buying or selling the contracts for speculative purposes neither want possession of the underlying commodity nor possess the underlying commodity and have the ability to physically deliver.

While there are some some legitimate measures such as oil or gold companies that sell forward their production, and the number of gold companies has increasingly withered, in many cases when you buy these gold derivatives you are buying from a speculator who is shorting gold and that gold speculator does not actually own any physical gold.

MECHANICS OF AN EXCHANGE BANKRUPTCY

Let us assume for the sake of argument that gold prices go ballistic and you decide you want your gold by taking delivery on the contract. What if gold prices go up dramatically in one day such as a thousand dollars an ounce. Is it possible? Of course. Is it probable? Not really.

But that means the person who shorted gold is in a very precarious position and could have possibly lost everything or more. Perhaps they had a stop but the market is fast and gaps and as a result they cannot get out of their position. What would happen?

Let us assume this speculator had ten thousand dollars in their commodities account and they were short a gold contract. Suddenly, perhaps overnight, the Chinese press the issue because the International Monetary Fund failed to deliver on their gold sales and needed a line of credit, gold prices rapidly jumped and this speculator lost a hundred thousand dollars overnight. Now the brokerage firm has to attempt to collect on this ninety thousand dollar margin call in the form of an unsecured debt. What if they cannot collect and what if there are hundreds or thousands of speculators in similar situations?

With this failure to deliver and violation of margin requirements what if the exchange, because they do not have adequate capital or liquidity, cannot get the currency to settle the contracts? Then the exchange goes broke unless there is a government bail out but what good would that fiat currency do in purchasing the physical gold or silver bullion?

COUNTER-PARTY RISK MATERIALIZING

This is what happened with the American Insurance Group. The reason AIG went bankrupt is because they were the other side of many speculative contracts. When the flock of black swans they had insured against descended AIG could not perform because they did not have the cash. The government bailed them out at the cost of hundreds of billions if not trillions of dollars.

This means if you buy silver or gold on the COMEX via futures contracts, there is a huge move up, the COMEX goes bankrupt and the government does not bail them out then you are not going to be able to cash out your epic gains from the casino. Like the auto maker’s bond holders you will not realize and enjoy the profits you thought you would.

This is precisely what happened with people who were short a bunch of oranges and other interesting things via hedges with Lehman Brothers and even though they ‘made’ millions of dollars on their positions they lost everything. Why? Because Lehman Brothers went under and did not perform on the contracts. This is counter-party risk.

CONCLUSION

At all time and in all circumstances gold and silver remain money. For the conservative investor the reason to own them is as insurance for when everything else fails. These issues of counter-party risk are important when considering how to buy gold or silver through third parties. There are third-parties, like GoldMoney, that not subject to counter-party risk because of the way ownership is titled and the ability to demand physical delivery at any time.

As I explain in my book The Great Credit Contractioncapital is burrowing down the pyramid into safer and more liquid assets. The safest and most liquid of them all are gold and silver. Why? Because the world reserve currency the FRN$ is merely an illusion that can become worthless while gold and silver are money and will always buy something.

Consequently, the conservative investor will determine what their gold standard is considering there are 140 ounces of paper gold for every ounce of physical gold. Then they will take appropriate actions, such asbuying gold in a vending machine, to remove the layers of risk between them and their purchasing power in an effort to preserve and safeguard their capital.

Buy "The Great Credit Contraction" eBook

Disclosures: Long real gold and silver with no position in Treasury bills, GLD, SLV, Irish debt and no party invitations.

Trace Mayer, J.D.

--

http://www.RunToGold.com


-- Posted Friday, 19 June 2009 | Digg This Article | Source: GoldSeek.com