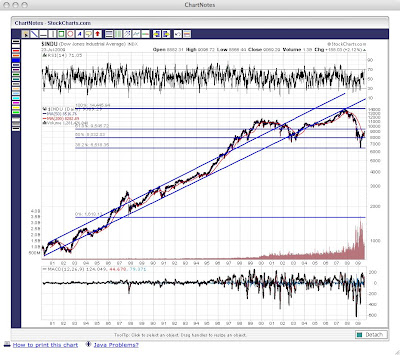
Folks, let's not get carried away with the Dow breaking 9,000, because the long term chart suggests something much different. If your buying into the current propaganda, you will be left heartbroken and broke. Right now, your probably breathing a sigh of relief that your current 401K is resembling a 301K, but let me suggest you might be left with a 101K if the chart is any indication. After fielding a couple of questions on the long term possibilities on the DOW, I decided to run my long term chart for the answers. So wholla.....Here is what the chart is telling me. Let's look at the chart from 1981 to present. As you can see, the DOW generally trends upwards between the upper and lower resistance bands and trends between them from high to low. Now let's take a look at the first significant event on this chart which is the year 1987. As you can see, the DOW broke out of the upper resistance band in Jan 87. By Oct 87, it corrected all the way back down to the lower resistance band and luckily held at that point. That minor correction is known as the Stock Market crash of 1987. Technically speaking it was just a correction from the stupid over speculation that the market could operate out of the norm. Now having righted the market. The market continued it's trend until March of 1996. Uh oh. The retard speculators are back. Having sat on their hands for nearly 9 years. They were eager to pump up the market and use the great technology boom to do so. Like clock work, the market was pumped up over the upper resistance band until 11 Sep 2001. We all know what happened on that day, so I won't go into detail. Needless to say, the bubble was popped and eventually corrected below the long term resistance line. With that bubble popped and the market righted, we should of left it alone - but no so fast. How could we re-inflate the market back to the long term trend. Enter the Grand housing Boom bubble. McMansion's for everyone was the dream and the dream was realized with B.S. financing programs. No money down and cheap interest rates were the catch phrase of the day. Bad Credit or No credit! It didn't really matter. You were getting your McMasion. Now take a look at the chart. They couldn't even get the market back within the long term trend lines with the great housing boom. Sadly, it all blew up with most Americans caught with their pants down and the market corrected all the way down to around 6500ish. Does that number sound familiar? Look at the chart! 6500 is where the bubble started in 1996. They used two consecutive bubbles to keep it a float until it deflated back to where it started. 6500ISH! The two bubble are so obvious it probably makes you feel like a fool! Hind sight is not 20/20. If you would of followed the trend, you would of known what was coming. Speaking of what is coming? Does the Energy Bill (Cap and Trade) and the Health Reform Care Bill sound familiar? Why do you think they're pushing hard for this? Oh yes, you guessed it. They need to start the next bubble, so be prepared! O.K.....one last look at the chart. The market should attempt to test the 61.8% Fib level at 9500. If the 9500 number is not broken, look out below. (If 9500 is broken, it must hold for two consecutive days.) The Dow will correct back to 8,000 and if 8,000 doesn't hold look to 6,500. Now here's where it can get scary. If 6,500 is broken, 5,200 offers some some support along with 4,000. If a "Black Swan" events occurs, 1,600 is where it will settle. Be prepared!